An important but overlooked report released this past week was the Mortgage Monitor for April (pdf) from Lender Processing Services (LPS), which we've been following as a proxy for the ongoing mortgage crisis...LPS reported that 3,111,000, or 6.21% of home mortgages, were more than 30 days delinquent but not foreclosure in April, down from a delinquency rate of 6.59% in March; of those, 1,717,000 homes were more than 30 and less than 90 days past due, and 1,394,000 mortgages were more than 90 days delinquent, in addition, LPS counts 1,588,000 homes, or 3.17% of all mortgages, in the foreclosure process; which gives us a total of 4,699,000, or 9.76% of home loans delinquent or in foreclosure as of April 30th, which marks the first time since 2008 that the total percentage of mortgages in arrears has fallen below 10%
Part of this reduction in delinquencies is seasonal; as we've seen, significant numbers of homeowners forego mortgage payments before Christmas, and typically catch up by March or April...LPS also noted the highest rate of completed foreclosures in judicial states since 2010, which reduced the foreclosure inventory by 5.83%; nonetheless, homes in foreclosure are remaining delinquent in those states that require judicial review an average of nearly three years before the "foreclosure sale" is completed (you'll recall foreclosure sales is a mortgage industry euphemism for home seizures, after which the home becomes part of the banks REO, or real estate owned - the glossary of terms used is on page 23 of the pdf) ...foreclosure sales as a percentage of the then current foreclosure inventory, which is the number of home mortgages stranded in the foreclosure process, is shown in the chart to the upper right; each line tracks the percentage of homes in foreclosure that are seized in any given month; the blue line tracks that metric for judicial states, or those where a court review is necessary for a home to be seized, which was at 3.01% of all judicial mortgages in April, 16.87% above the home seizure rate for judicial states in March; the red line tracks the percentage of foreclosed homes seized in non-judicial states, where foreclosures need not be handled through the courts; in April, that rate was 6.88%, a 10.95% month over month increase.
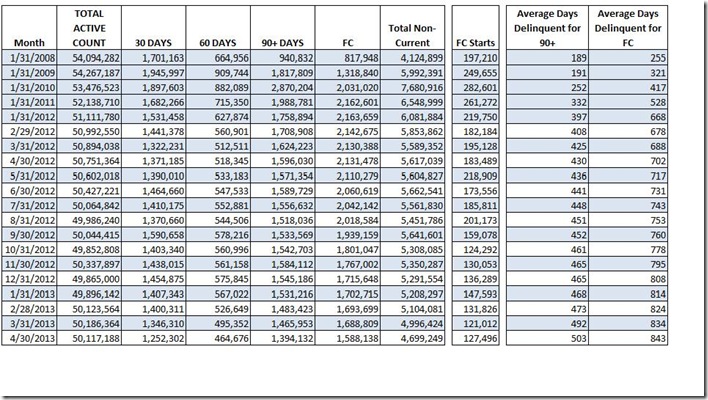
Data from the table below, taken from page 20 of the LPS pdf, best illustrates where we've been and how far we have yet to go; each line first shows the month and the total active count, or the total number of mortgages nationwide in that month; subsequent columns show the actual number of delinquent mortgages that are 30, 60, more than 90 days delinquent, or in foreclosure (FC), with a sum of the non current in the next column (the big jump in short term delinquencies in September last year was due to the release of the iphone5)...then there's also a separate column for foreclosure starts in each month...but it's the last two columns that tell the story, as they give the accumulating days that an average home mortgage has remained either delinquent or in foreclosure without proceeding to the next step; you can see that as of April, the average seriously delinquent homeowner has not paid on their mortgage for 503 days, and that the typical home in foreclosure has remained there for 843 days; in general, those who are seriously delinquent (more than 90 days past due) are not being foreclosed on, and those who are in the foreclosure process are not having their homes seized...since this metric seems to be increasing an average of ten days a month, and new foreclosure starts are being added each month which should be bringing the average down, we can only conclude that the foreclosure process is damn near frozen...and as we'll see in the next graphic, this isnt just because the courts are clogged...
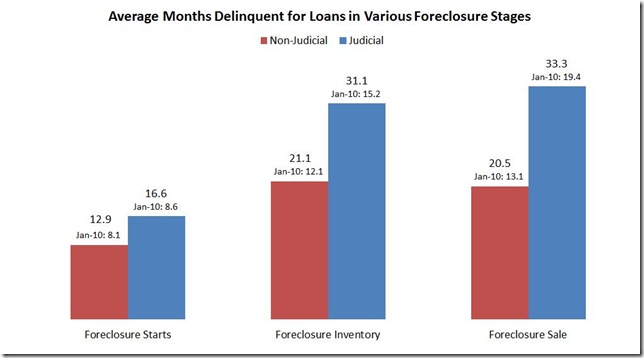
Below we have a set of bar graphs from page 13 of the LPS pdf; as the heading reads, they show the average months delinquent for various stages of foreclosure, and again, blue represents the times for judicial states, and red for non-judicial states; the top number over each bar represents the number of months a loan has been delinquent in that stage as of April; in the small print below that are the months delinquent for each stage and type as of January 2010, the peak of the crisis...so we can clearly see that at that time, foreclosures were being started after 8 months of delinquency in both judicial and non-judicial states, but now even starting the proceedings is delayed an average of 12.9 months for non-judicial states. and 16.6 months for judicial states, or nearly twice as long...also note the length of time homeowners spend in the foreclosure process (aka foreclosure inventory) in non judicial states, where court delays cant be blamed; early in the crisis it was 12.1 months, as of April, it’s stretched out to 21.1 months…
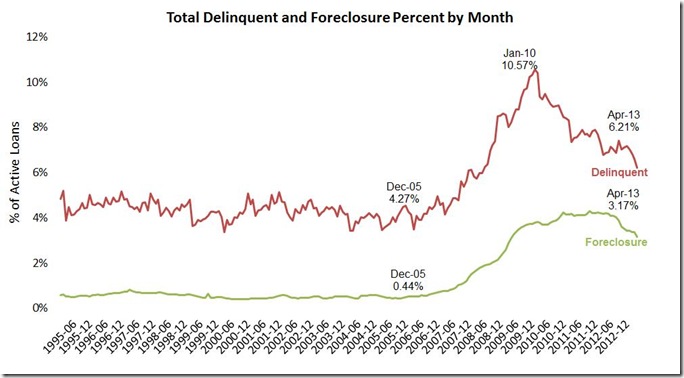
Lastly, the graph on the bottom above summarizes the delinquency and foreclosure history of US mortgages going back to 1995, showing both as a percentage of the active loan counts; there's a callout for December 2005. presumably because .44% in foreclosure and 4.27% delinquent would represent a normal level of mortgages in trouble...you see delinquencies, tracked in red, peaked at 10.57% in January 2010, and have now fallen to 6.27%; the seasonal pattern for delinquencies is also evident...and the foreclosure inventory in green is now down to 3.17%....most of the mortgage monitor is graphics like these above with little detail; the data summary for the past 12 months is on page 18 of the pdf: if you are so inclined, you can also watch LPS Applied Analytics Senior Vice President Herb Blecher explain some of the graphics in a video presentation…
(cross posted from Marketwatch 666)


Comments
not sure what this means
I'm gathering this is saying foreclosures and delinquencies are down, yet does it explain the super short inventories that are in part driving up home prices?
doesnt say much about prices
it's hard to relate what we see in this report to low home inventories for sale, except that it suggests the banks are still holding more housing inventory than they want...from this, it seems they just dont want to take possession of many more properties; they may see it in their interest to allow families to occupy and upkeep houses, even though they're generating no revenue, rather than have them empty and vandalized
rjs
supply-demand
I would never give banks any credit for being nice towards mortgage holders. At minimum due to Foreclosure gate they don't want to be sued again.
I think this is much more about limiting supply. That will generate artificial demand and thus prices increase.
(Law of Supply and Demand Econ 101)
That's my take on the hidden housing inventory.
In New York and California, Selling to Corporations of Foreclosu
Foreclosures are going to mostly corporate buyers in both coasts. Those corporations are mostly fronts. The froth in real estate is partly foreign buying in the most expansive markets.
Burton Leed