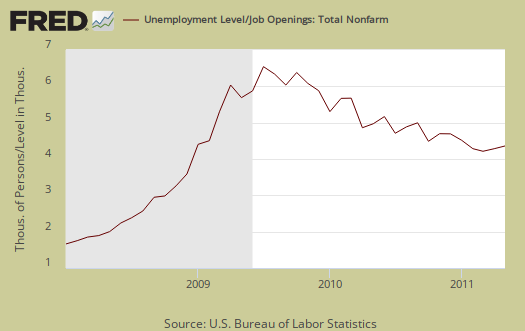
JOLTS stands for Job Openings and Labor Turnover Survey. The July 12th report on May 2011 data shows there were 4.68 official unemployed people hunting for a job to every position available. There were only 2,974,000 job openings for May 2011, almost the same, +0.7%, from the previous month. Below is the graph of number of official unemployed per job opening for May 2011.
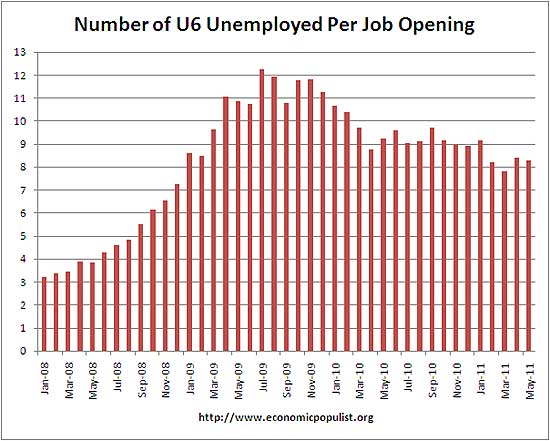
If one takes the official broader definition of unemployment, or U6, in May at 15.8%, the ratio becomes even worse, 8.28* unemployed people per each job opening for May. Bear in mind U6 jumped to 16.2% in June. Below is the graph of number of unemployed, using the broader U6 unemployment definition, per job opening.
If you do not like the use of U6 to look at the real number of people looking for a job to actual opportunities, consider this number. In May 2011, of those not in the labor force, 6,227,000 were actually wanting a job. In June that number was 6.5 million.
The rates below mean the number of openings, hires, fires percentage of the total employment. Openings are added to the total employment for it's ratio.
- openings rate - 2.2%
- hires rate - 3.1%
- separations rate - 3.1%
Below are raw job openings, way below pre-recession levels.
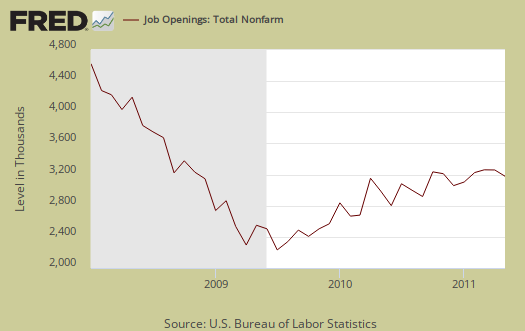
Believe this or not, one month past the so called end of the Great Recession, July 2009, job openings have only increased 862,000. That's pathetic.
We can see some of this in the actual hires from May, which only increased 69,000, or 1.72%. Before you get excited about this measly percentage, read on to separations.
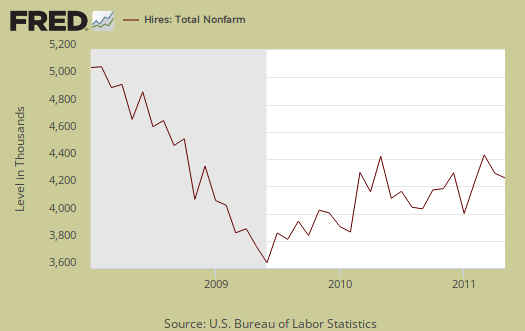
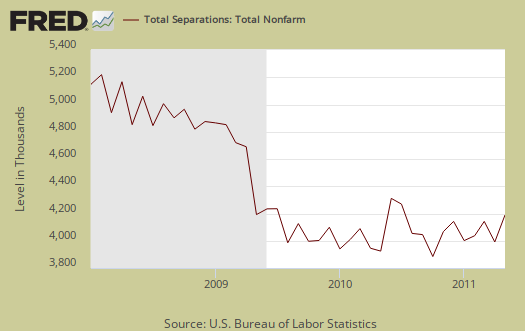
Below are total job separations, 4,059,000, which is a monthly increase of 226,000 or 5.9%. The term separation means you're out of a job through a layoff, quitting or retirement. Notice how separations is almost equal to the number of hires, 4,070,000. Seems the revolving door has come to working America, although not quite the same as the one in Washington D.C.
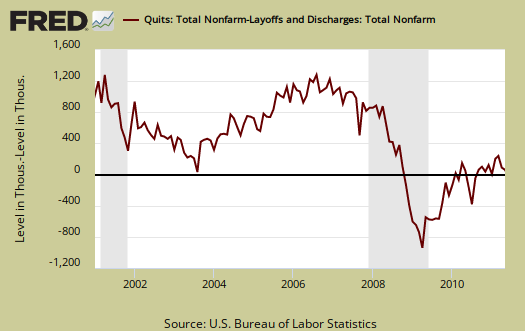
The number of quits or voluntary job separations is becoming dangerously close to the number of fires. Want a choice of employers? Doesn't seem to be much of an option today. Quits were 49% of the total separations whereas layoffs and fires were 44% in May.
Below are quits minus discharges and layoffs. What this graph shows is how people do not have a choice in jobs, the number of people being forced out of their job is more equaling the number who plain quit, which implies little choice and those who have a job are hanging on for dear life.
The JOLTS takes a random sampling of 16,000 businesses and derives their numbers from that. The survey also uses the CES, or current employment statistics, not the household survey as their base benchmark, although ratios are coming from the household survey, which gives the tally of unemployed.
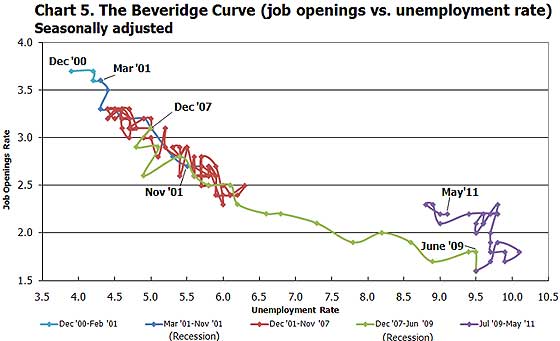
The BLS was kind enough to make a credible Beveridge Curve graph, reprinted below. The Beveridge curve shows the official unemployment rate vs. the job openings rate. If you see a bunch of data points to the far right, that's bad, it means there is long term unemployment and not enough jobs. Look at how we're stuck to the right and moving right. The green, representing the 2009 time period, shows how fast we went to the right and the purple, which is 2010, 2011, means we are stuck there. This means there are no jobs! This graph shows working America is in big trouble and considering how the June unemployment report is much worse, don't expect things to get better.
For the JOLTS report, the BLS creates some fairly useful graphs, some of which were reprinted here, and they have oodles of additional information in their databases, broken down by occupational area. The Saint Louis Federal Reserve also had loads of graphing tools for JOLTS. Below is a reprint of the BLS bubble graph, and the first thing to note is how health and educational employment dwarfs manufacturing. For economies of scale, we really need to see that manufacturing bubble grow and grow, it's about 11% of the total economy which is not good for a host of reasons.
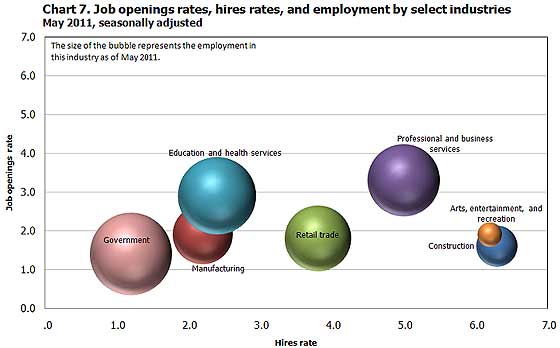
Also, bear in mind professional and technical services is notorious to import workers on foreign guest worker Visas, displacing Americans. Employers also quite often put out fictional job openings, demanding perfect skill matches to the point no one on the globe has that experience.
To put these ratios into perspective, there were 4.8 million job openings in March 2007 and believe this or not, the low point of job openings was in July 2009.
* is defined as the official unemployed plus people who are in part-time jobs for economic reasons plus the marginally attached. The marginally attached,
, are officially not part of the civilian labor force,
, and also not seasonally adjusted. The above graph was created by applying this formula:
where

This report overview is way late, yes I know
The BLS released this report 5 days ago and I just couldn't get to it until now. Despite it's not out of the news cycle, I do not care for there were groups, other analysts who thought this report was fine and improving and frankly it is not. Plus if there is one topic this site focuses on above the other economics sites, it's labor, jobs. So, gotta have an overview on the JOLTS report.
Thanks for understanding and really check out this Beveridge curve. That's really a nice thing the BLS puts out for us for it really shows we have a jobs crisis in this country.
I Wish We Could Declare a Official Jobs Emergency
So there were people "who thought this report was fine and improving"? I suppose that would be the same gang who think that every slight uptick in anything means things will be back to normal soon so there's no need to do anything but wait and hope.
I've had enough of both waiting and hoping, thank you very much for nothing, so-called "leaders" of America. How about some effective planning for job drought lasting until 2016 or later and acting accordingly?
There's scales of intensity for tornadoes and hurricanes.
I wish there were a similar scale for unemployment. It would be good too if there were some proscribed rules for various actions that needed to be taken by the government depending on the severity of unemployment, subject to Congressional modification.
I am dreaming I know but I refuse to accept that the we should continue to do nothing and allow the unemployed to go over the cliff and stay there.
Jobs are the bottom line to all things
They won't even bring up policies that are in dire need. Case in point, instead of confronting China on currency manipulation they are pushing more trade deals analyzed to lose more U.S. jobs. Instead of curtailing offshore outsourcing, we get more and more outsourcers straight in the White House.
Instead of putting together an infrastructure jobs program, direct, we get cutting domestic spending....all the while pouring money overseas to build other countries.
Instead of forcing companies operating here to hire and use U.S. citizens, they are enabling those very companies to avoid paying any taxes, tax havens go unabated and the Panama trade deal will proliferate even more tax havens.
They won't even put conditions requiring these companies to hire and retain U.S. citizen workers for tax breaks and that's at every level, local, state federal.
swapped out U6 per job openings graph
I found out, which is a bummer because I couldn't use FRED graphing system as a result, that U-6 is calculated using the above, even for the reported percentage. Originally I didn't think so since marginally attached is not seasonally adjusted plus, the marginally attached amount is about 300k additional people in comparison to 24.3 million, so it's almost in the margin of error. Usually it's sacrosanct to not mix seasonally adjusted and not seasonally adjusted plus I figured it was close, due to the marginally attached being so small of a number in relation to the CLF.
Regardless, the U6 levels calculation matches the BLS U-6 method, (although they do not seem to publish U-6 levels directly, one must add up the variables only, which are published). The BLS just publishes the U6 percentage directly.
Then, of those in part-time jobs, those are only the people who report they are in them because they cannot get full-time jobs. So these are your people working, potentially, 2 or 3 jobs trying to survive or plain can only get 1 part time job. This implies they are really out there looking for a better, full time job, so they do assuredly count in the ratios of jobs to people looking.
It's people, not jobs in this tally. These numbers are from the CPS.
Regardless of how one looks at it, it's clear the job market is God awful for U.S. labor.
I just wanted to make sure I was matching all my p's and q's. JOLTS, obviously, does not consider U6 and that's no surprise, it's not designed for that.
I just add the U6 figure since so many are interested in it and rightly so. Due to such weak labor demand U6 is becoming more important as is trying to squeeze out how many workers have dropped out of the labor force, or been downgraded into crappy part time jobs, to determine those who really want a job.
On that score the BLS does give a number people not part of the labor force who actually want a job, which is probably just as important as U6 and that number is shockingly high.
Tariff promotes domestic manufacturing
" ... we really need to see that manufacturing bubble [in the BLS bubble graph] grow and grow, it's about 11% of the total economy which is not good for a host of reasons." -- Robert Oak
We need to open up our congress critturs to the fact that the fundamentals of current U.S. trade policy are delusional and dysfunctional. Why in the world are congressional Republicans, including the new tea-partiers, afraid even to use the word 'tariff'? Tea Party could join with some progressive Democrats on this issue and really make a difference. After all, for at least its first hundred years, the Republican Party was the pro-tariff party!
Demand 15% ACROSS-THE-BOARD TARIFF in your communications with members of Congress! The 15% ACROSS-THE-BOARD TARIFF will give U.S. industry room to breathe and to grow.
Why "across the board"? Demand 15% ACROSS-THE-BOARD TARIFF to replace all the preference systems. Little targeted tariffs here and there court trade wars and reflect official policy of political corruption that typifies neo-mercantilism. Targeted tariffs are inefficient -- like targeted tax breaks (more correctly termed 'loopholes').
To turn the U.S. around, we need to reject, unambiguously, the neo-mercantilism model that the U.S. has disastrously embraced.
Tariff promotes domestic manufacturing ... and even increases revenue to balance the budget!
tariffs don't stand a chance
Congress could pass an across the board tariff against China for currency manipulation but it's clear Geithner, Obama refuse to support it.
But overall, tariffs would be ruled illegal by the WTO. A VAT, on the other hand, is legal by the WTO and can more finely tuned as well as be dynamic and that is legal as well.
A VAT is regressive, since it's a value added tax on imports, but it can be structured to make it less regressive and could really help with the trade imbalance.
Tariffs are like an axe and VATs are like a scalpel, although on China's case, there are bills in Congress that almost every member has co-signed.
So, Reps/Senators supposedly support the bills because they have co-signed them yet they are never brought to the floor for a vote.
nothing here at EP stands a chance
And, then again, who knows? We can try. The truth is its own defense.
As for the prospect that tariffs would be ruled illegal by the WTO ... GOOD ! ! !
The WTO is a paper tiger! I consider it a positive aspect of an across-the-board tariff that it would call the WTO bluff.
Since the VAT bills in Congress are all 'fine-tuned' around China, they are prima facie in violation of WTO principles! By comparison, the Across-the-Board Tariff (ABT) is simply a reasonable charge for access to the U.S. infrastructure that we do, after all, support with our tax dollar. Therefore, ABT may be defended as legal in WTO quasi-judicial fora. (The ABT is never anti-China or in any way discriminatory or preferential by industry or nation of origin.)
Concerns about WTO legalities always leave me under-impressed. International trade did not originate with GATT and it would not end with the demise of the WTO. Who's afraid of the big bad WTO wuff, wuff, wuff? "I'll huff and I'll puff and I'll BLOW your house down!"
But okay. If you want to promote VATs, fine. That would be much preferable to what we have now.
However, I think you may want to reconsider the tariff approach -- specifically, the Across-the-Board Tariff (ABT) approach.
In defense of Across-the-Board Tariff
If we had a populist national political leader outside the two branches of the Money Party, such a leader would much prefer to go for the gusto with ABT than promote a 'VAT' of which the last word is 'tax'! This is called a populist reform approach.
As for the philosophical side, the purpose of the ABT is to free our thinking from the neo-mercantilism model and restructure thinking about globalism on a new basis. We want to restructure globalism leaving out the part about destruction of the nation-state. This is called a reform process.
Other than the supposed "legality" of VATs in the quasi-legal WTO system, virtue is found in VATs because they are capable of "fine tuning" and "dynamic." As part of this theory on VATs, it is proposed that undesirable regressive impacts of VATs can be lessened by proper structuring. That's exactly what I think we need to avoid, and why I promote an Across-the-Board Tariff (ABT)!
The suggestion to fine-tune VATs so as to avoid "regressive" consequences lands us smack back in the middle of ever-competing agendas to fix social problems through trade policies. Of course, these 'social problems' are represented in political agendas and, as such, are subject to the political compromises that put profiteering politics into the middle of every business decision.
This kind of thinking is what results in a tangle of tax preferences that result in a system of tax loopholes. Just as we need a sane monetarist system of currency supply rather than a fix-this, fix-that Keynesian-like quasi-collectivist system, so also we need a stable protectionist policy -- not dynamic, not "fine tuned," but stable and predictable for the sake of long-term development of free enterprise.
This kind of thinking ('fine-tuned' and 'dynamic') is shared by Secretary of State Clinton when she packs corporate interests with her on diplomatic missions. Clinton has openly stated that she views foreign trade as part of U.S. global security policy. It all reduces to that trade policies should serve interests other than creating a stable de-politicized business environment. That is neo-mercantilism and, ultimately, it is anti-globalism, because it is policy in favor of globalism as global enslavement. That is the problem. That is the loophole that allows political corruption to determine such matters as targeted tariffs or 'fine-tuned' VATs.
By the Constitution, "trade agreements" should never be confused with national security policy. That's why I promote specifically 15% ACROSS-THE-BOARD TARIFF to replace the existing U.S. system of preferences and targeted tariffs or subsidies (or VATs).
Highfalutin pretensions (e.g., let's avoid regressive consequences for the sake of the poor) have always been promoted as rationalizations for corporatism. On the road paved with good intentions, we have created the U.S. system of preferences of all kinds for the purpose of this, that or the other social agenda -- and the end result is the destruction of free enterprise on which civil liberty is based.
Great report
Yours is one of the best overviews of JOLTS available.
Thank you, I try
I appreciate that.