Last week the Mortgage Monitor for November (pdf) from Black Knight Financial Services (BKFS, formerly LPS) reported that there were 697,944 home mortgages, or 1.38% of all mortgages outstanding, remaining in the foreclosure process at the end of November, which was down from 721,435, or 1.46% of all active loans that were in foreclosure at the end of October, and down from 1.81% of all mortgages that were in foreclosure in November of last year. These are homeowners who had a foreclosure notice served but whose homes had not yet been seized, and the November "foreclosure inventory" is now showing the lowest percentage of homes that were in the foreclosure process since the fall of 2007. New foreclosure starts, meanwhile, were at their lowest level since April 2006, falling to 66,626 in November from 73,218 in October and from 81,437 in November a year ago, although BKFS cautions there is "some degree of seasonality" in the drop in foreclosure starts, as the month contained two federal holidays (Veterans Day and Thanksgiving Day) and 5 weekends.
There was also likely some degree of seasonality in the increase in those who were delinquent on paying their mortgage, as we've often seen more homeowners fall behind on house payments during the Christmas shopping months. BKFS data showed that 2,490,817 mortgages, or 4.92% of all mortgage loans, or were at least one mortgage payment overdue but not in foreclosure in November, up from 2,414,583, or 4.77% of all homeowners with a mortgage, who were more than 30 days behind on their mortgage in October. While that was the highest mortgage delinquency rate since February, it's still down from the mortgage delinquency rate of 6.03% in November a year earlier. Of those who were delinquent in November, 827,338 home owners, or 1.64% of those with a mortgage, were considered seriously delinquent, meaning they were more than 90 days behind on mortgage payments, but still not in foreclosure at the end of the month. Combining these totals, we find a total of 6.30% of homeowners with a mortgage were either late in paying or in foreclosure at the end of November, and 3.02% of them were in serious trouble, ie, either "seriously delinquent" or already in foreclosure at month end.
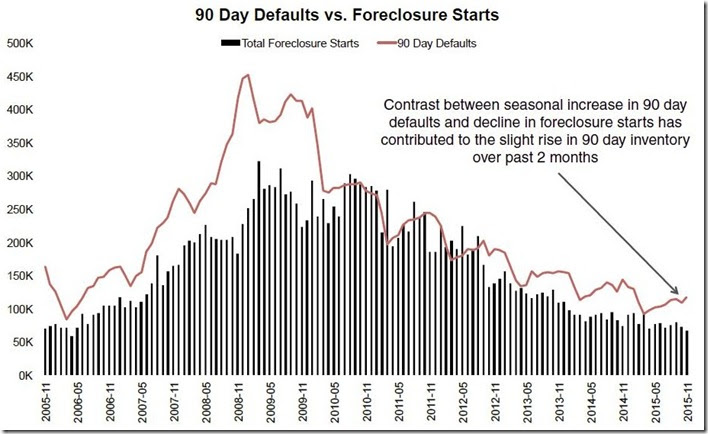
The Mortgage Monitor (pdf) is a mostly graphics presentation from what was once the Analytics division of Lender Processing Services that covers a variety of mortgage related issues each month. The first graph we have selected below comes from page 6 of the mortgage monitor and shows the number of new 90 day delinquencies each month, or those who just fallen 90 days behind on their mortgage, as a dark red line over the period from November 2005 to this month’s report. Then it shows the number of new foreclosure starts over the same period marked by black bars each month. As you can see, the 90 day delinquencies have increased 27% since March, but they're still 19% below last year's November high. In the callout on the graph, BKFS explains that the rise in new 90 day delinquencies over the past several months coupled with the low foreclosure start rate is the reason that the inventory of those who are at least 3 months behind on their mortgage and have not yet been foreclosed on is rising.
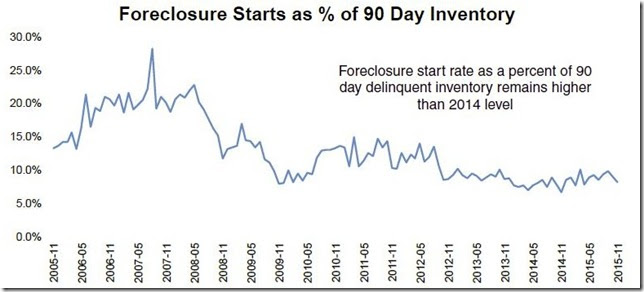
Understand that the above graph just shows the new 90 day delinquencies, and that the total of all of those who are more than 90 days overdue on their mortgage is much larger (827,338 home owners, as noted in our summary above). The percentage of those who are seriously delinquent who are being foreclosed on each month can be more clearly seen in the graph below, from page 5 of the mortgage monitor, which shows foreclosure starts as a percentage of 90 day delinquent mortgages tracked in blue. Since, as they point out, foreclosure starts as a percentage of 90-day delinquent loans is higher than 2014's level, a slightly higher percentage of remaining 90 day delinquent loans are being foreclosed on monthly, despite the lower number of foreclosure starts.
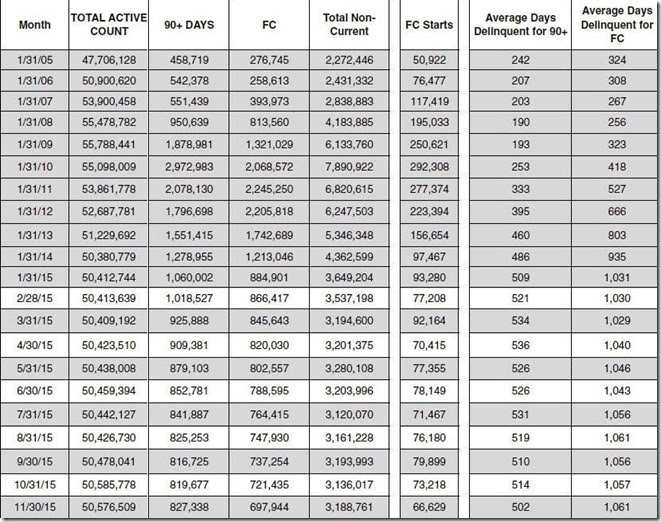
Lastly, we’ll include below that part of a Mortgage Monitor table summarizing the monthly count of active home mortgage loans and their delinquency status, which comes from page 13 of the pdf. The columns in the table below show the total active mortgage loan count nationally for each month given, number of mortgages that were delinquent by more than 90 days but not yet in foreclosure, the monthly count of those mortgages that are in the foreclosure process (FC), the total non-current mortgages, including those that just missed one or two payments, and then the number of foreclosure starts for each month over the past and for each January shown going back to January 2005. In the last two columns, we see the average length of time that those who have been more than 90 days delinquent have remained in their homes without foreclosure, and then the average number of days those in foreclosure have been stuck in that process because of the lengthy foreclosure pipelines. The average length of delinquency for those who have been more than 90 days delinquent without foreclosure has been falling from the April record of 536 days and is now at 502 days, while the average time for those who’ve been in foreclosure without a resolution is back to its record high of 1061 days that was set in August, meaning the average homeowner who is in foreclosure has been there nearly three years. Considering ongoing new foreclosure starts are part of the aggregate, to arrive at an average time in foreclosure length that long almost certainly means that many foreclosures started early in the crisis are still not yet completed.
(note: the above was excerpted from my weekly synopsis at Marketwatch 666)


that's astounding!
Good God, you could stay in a house for a long time rent free with these statistics. Gives new meaning to strategic default.