The National Association of Realtors released their pending home sales for November 2011. We have headline buzz blaring highest pending home sales in 19 months as well as claims the entire economy is on the road to recovery, based on just this one private sector housing data report.

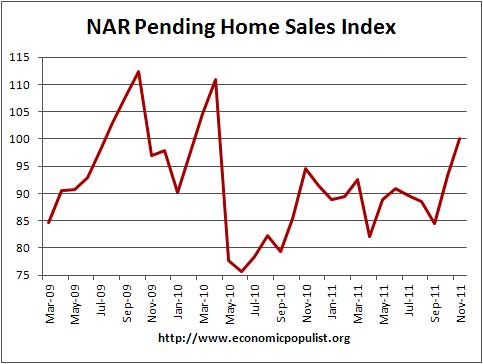
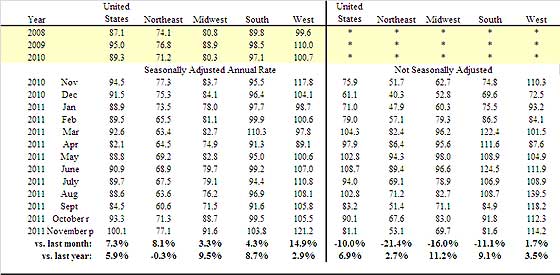
The Pending Home Sales Index,* a forward-looking indicator based on contract signings, increased 7.3 percent to 100.1 in November from an upwardly revised 93.3 in October and is 5.9 percent above November 2010 when it stood at 94.5. The October upward revision resulted in a 10.4 percent monthly gain.
The last time the index was higher was in April 2010 when it reached 111.5 as buyers rushed to beat the deadline for the home buyer tax credit. The data reflects contracts but not closings.
Yet when one looks at the graph, we see a few things. First, it's noisy, the slope is not a clean ascent or consistent monthly change. Then, we see the index higher when the housing market was in the depths of the deflated residential real estate bubble. Finally, existing home sales do not add to GDP because they are a wealth transfer. The transaction fees do add to economic growth of course and selling existing homes creates jobs. Yet the actual existing home was already counted as economic growth when it was built.
We've seen this headline buzz before, pending home sales jump to a 2 year high. This financial press headline hype was for July 2009 PHSI. The actual data had everything to do with the temporary first time home buyer's tax credit versus a sustained residential real estate market recovery. It looks probable the worst is over for residential real estate but having a dramatic uptick in activity, just simply is not going to happen. Been there, done that and the middle class is literally out of work and out of money to boot. Can't buy too many houses on food stamps.
The PHSI are contracts which have not yet closed and why it is considered a future housing indicator. From the NAR:
NAR's Pending Home Sales Index (PHSI) is released during the first week of each month. It is designed to be a leading indicator of housing activity.
The index measures housing contract activity. It is based on signed real estate contracts for existing single-family homes, condos and co-ops. A signed contract is not counted as a sale until the transaction closes. Modeling for the PHSI looks at the monthly relationship between existing-home sale contracts and transaction closings over the last four years.
We had earlier a report where 33% of contracts were cancelled. Additionally, as we can see from the above graph, the PHSI has been higher after the housing bubble burst, so people believing magically all is well with the housing market from this report are in fantasy land.

Indeed, even NAR is noting the unusual number of contract failures, implies this month's dramatic increase could be people trying it again:
Housing affordability conditions are at a record high and there is a pent-up demand from buyers who’ve been on the sidelines, but contract failures have been running unusually high. Some of the increase in pending home sales appears to be from buyers recommitting after an initial contract ran into problems, often with the mortgage.

Recent comments