At their meeting in Vienna on Wednesday, the member nations of OPEC agreed to cut their oil production by 4.5% for a period to run 6 months, effective January 1st. The amount of oil output each member is expected to forgo is generally based on their October production, although for some countries, such as Iran, the baseline for the output cut has been adjusted for special factors. Libya and Nigeria, whose recent production has been disrupted by civil conflict, will be exempt from the cuts. Indonesia, an OPEC oil importer who would not agree to a cut, was suspended from OPEC, and what they would have cut was to be absorbed by other member. Figures released by OPEC indicate they want a cut of almost 1.2 million barrels per day, or roughly in line with what we previewed last week. In addition, OPEC announced that non-OPEC oil producers, who were not represented at the meeting, will contribute an additional output cut of 600,000 barrels per day. Presumably, details on those non-OPEC oil production cuts will be worked out at a December 9th meeting at Doha, but since Russia is on board with a cut of 300,000 barrels per day, achieving that target should not be difficult. Oil traders apparently believe that OPEC and other producers will be able to achieve what they've set out, because since the announcement of the deal, oil prices have risen 14%...
As you may recall, last week i was skeptical that such an agreement could be worked out, and thought that even if it were, it would quickly fall apart...i'm now of the opinion that their production cut will hold, and that it will be at least partially if not completely effective in reducing the global oil glut, and thereby push up the price of oil. One factor i hadn't counted on was the direct involvement of Vladimir Putin in the deal. Originally, the Russian oil companies had only committed to give up the increase in production they planned for next year; now it appears they've also been pressured into participating in an actual 300,000 barrels per day cut in their own production. Moreover, Putin himself acted as an intermediary between Saudi Prince Mohammed bin Salman and Iran's Ayatollah Ali Khamenei and President Hassan Rouhani to grease the skids for the deal that was eventually made, that allowed Iran's production figures to be overstated such that their "cut" actually amounts to a small increase from their current production. With the Saudis and Iranians waging proxy wars in both Syria and Yemen, that Putin could convince them to put their animosity aside and agree to a deal was the breakthrough that made this deal. Moreover, their strategy has already resulted an instant success, which will now convince all parties to hold the line regardless of their personal differences. After agreeing to cut their production by 4.5%, oil prices immediately rose 14%, so they already have a gain of 9.5% on the oil that they will be producing over what they would have had otherwise.
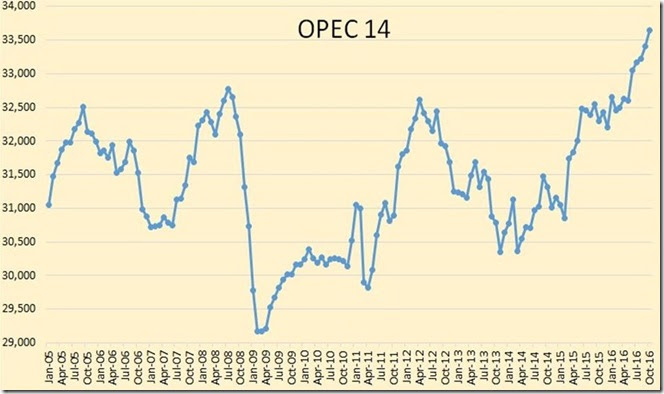
To put this production cutback in perspective, we'll next include a series of graphics which should give you a decent idea how big this production cut is relative to OPEC's recent and earlier oil production, and relative to the global oil supply. First, we'll start with a graph of OPEC's monthly oil production over the past dozen years...
The above graph, taken from the 'OPEC oil charts" page at the Peak Oil Barrel blog, shows total oil production, in thousands of barrels per day, for the 14 members of OPEC for the period from January 2005 to October 2016. As we pointed out last week, OPEC production has been spiking the past few months as member states pumped what they could to be better positioned for any percentage cutback resulting from this earlier planned meeting, and had reached 33.643 million barrels per day as of the October report. The agreed to production cuts will reduce their output to approximately 32.5 million barrels per day, which you should notice is about what they were producing in March and April of this year.
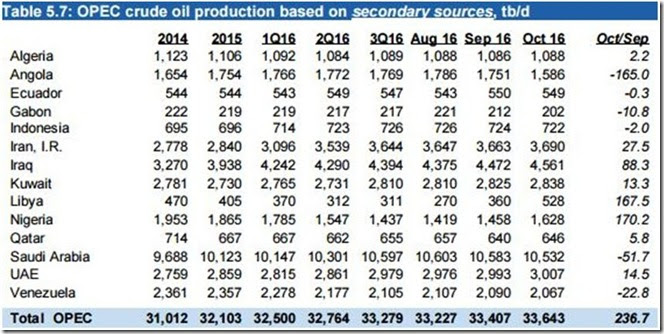
Next, we have a table of oil production by each of the members of OPEC for the recent months, quarters, and years, which comes from the November OPEC Monthly Oil Market Report, which was released on November 11th. Here you can see that the total oil output for the first quarter of 2016 (1Q16) was 32,500,000 barrels per day, exactly what these "cutbacks in production" hope to get back to. For the Persian Gulf OPEC members, much of cut that will be close to their normal seasonal reduction anyhow, since they usually ramp up their oil production during the summer months to generate electricity for air conditioning, then slow production in the fall.
note that the numbers shown in the October column above are close to the reference production levels on which the 4.5% production cuts are based...for instance, the Saudis will be cutting from 10,544,000 barrels per day back to 10,058,000 barrels per day, the Iraqis will be cutting from the 4,561,000 barrels per day shown above to 4,351,000 barrels per day, and the Kuwaitis will be cutting from 2,838,000 barrels per day to 2,707,000 barrels per day. The exception is for Iran, whose cuts are based on their production from Table 5.8: OPEC crude oil production based on direct communication in that same OPEC monthly report, wherein Iran reported oil production of 3,920,000 barrels per day in October...thus, when Iran cuts 4.5% from that level, their allowed production will be 3,797,000 barrels per day, actually 90,000 barrels per day more than their OPEC reference production...
The next graphic, as the heading tells us, shows both OPEC and world oil production monthly on the same graph, from November 2014 to October 2016, and it also comes from the November OPEC Monthly Oil Market Report. The pale blue bars represent OPEC oil production in millions of barrels per day as shown on the left scale, while the green graph represents global oil production in millions of barrels per day, and that's shown on the right scale. Global oil production reached 96.32 million barrels per day in October, just short of last year's November record, and OPEC production represented 34.9% of what was produced globally. We’ll also note that the June OPEC Monthly Oil Market Report indicates global production in May was at 94.51 million barrels per day, so if OPEC is successful in cutting their production by 1.2 barrels per day from October levels, and the non-OPEC producers cut another 600,000 barrels per day, global oil production will be reduced all the way back to the level that we saw in May of this year, when there was an acceleration of rebel attacks on oil facilities and pipelines in Nigeria and Canadian oil production was interrupted by the Alberta wildfires.
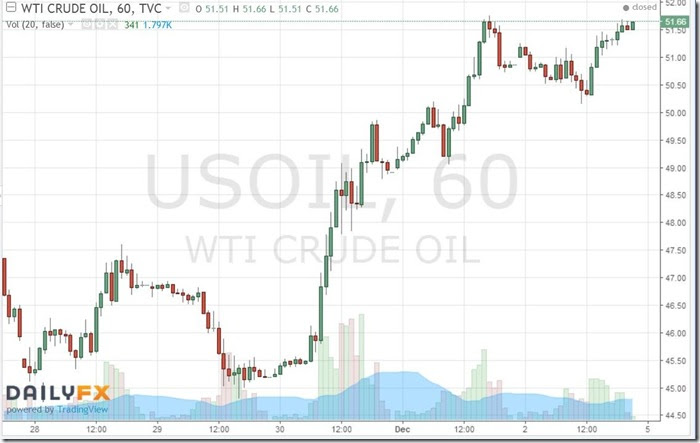
Lastly, instead of explaining in detail how oil prices moved this week, we'll just include a chart which shows oil prices for every hour, every day, for the 5 trading days in question. The graph below is a Saturday afternoon screenshot of the oil price graph at DailyFX, a trading news and analytics platform which specializes in foreign exchange (FX) trading. Each bar on this graph represents oil prices for one hour of trading; when oil prices went up during a given hour, the bar will be green, with the starting price at the bottom of the bar and the price at the end of the hour at the top of the bar. During those hours when the price of oil fell, the bar will be red, with the starting price at the top of the bar and the price at the end of the hour at the bottom of the bar. This variety of graph is called a candlestick, and the range of oil prices outside of the opening and closing price for any given period is indicated by a thin 'wick' above or below the "candlestick" part of the graph. Thus we can see that in the wee hours of Wednesday morning, when it appeared neither Iran or Iraq would agree to a cut, oil prices fell below $45 a barrel, as some were even forecasting that oil prices would fall to $20 a barrel after the presumed OPEC meeting failure. Oil prices then ran up to as high as $51.75 a barrel during the day on Thursday, before sliding back to close at $51.06. But the rally picked up steam again on Friday and oil closed the week with another gain at $51.68 a barrel, up 14.2% in the three days after the OPEC meeting..
Oil prices above $50 a barrel will likely accelerate the return of US drillers and frackers to the field, as we've already seen 5 months of steadily rising rig counts with oil prices stuck between $42 and $50 a barrel. Also recall that two weeks ago, the Drilling Productivity Report for November showed that the count of drilled but uncompleted wells rose to 5,155 in October, with more than half of those in the Permian and the Eagle Ford, the two big shale oil fields of Texas. We would expect a pickup in completion of those wells, and an attendant increase in US oil production as prices rise, partially ameliorating the OPEC production cuts. And should oil prices top $60 a barrel, the Dallas Fed 3rd quarter energy survey of American oil and gas executives indicates that between 65% and 70% of oil execs would then pull out all the stops and start drilling everywhere again.
note: the above was excerpted from my weekly synopsis at Focus on Fracking


Comments
that sux
Why can't they just all not get along?