Q2 2010 GDP, advance report, came in at 2.4%. Here is the actual report.
There is a huge discrepancy in the news release. Q1 2010 GDP, final was 2.7%. Now they have revised Q1 2010 to 3.7%, an entire percentage point! With revisions like that, in the first paragraph, the report details below are analyzed, with no warranty, as is, from the report.

As a reminder, GDP is made up of:
where
Y=GDP, C=Consumption, I=Investment, G=Government Spending, (X-M)=Net Exports, X=Exports, M=Imports.
Here is the Q2 2010 advance report breakdown of GDP percentage points:
- C = +1.15
- I = +3.14
- G = +0.88
- X = +1.22
- M = -4.00
As one can see, imports literally wiped out GDP growth.
Imports increase 2.8 times faster than exports. The trade deficit now contributes -2.78 of the total 2.4% Q2 2010 GDP.

The below graph is the change, quarterly, of real imports vs. exports. While exports increased, it is the trade deficit that matters. One cannot claim because one is filling up a hole while someone else is digging it, abet at a much smaller pace, that's great for the economy.

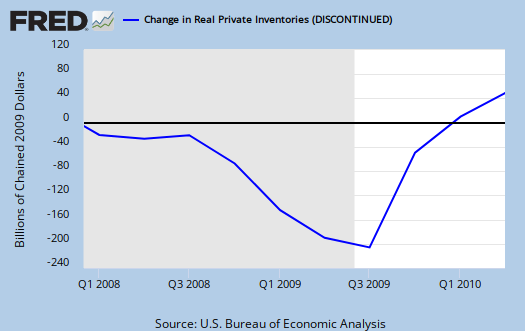
Changes in inventories contributed 1.05 of the total 2.4%or minus inventory changes, Q2 2010 GDP would have been 1.35%. The good news is investment in equipment and software contributed 1.36 of the total 2.4% GDP. Structures were flat lined, 0.14, but overall fixed investment, not including changes in inventories, contributed 2.04 points to GDP.

Below are the percentage changes of GDP components in comparison to the revised first quarter of 2010:
C: Real personal consumption expenditures increased 1.6 percent in the second quarter, compared with an increase of 1.9 percent in the first. Durable goods increased 7.5 percent, compared with an increase of 8.8 percent. Nondurable goods increased 1.6 percent, compared with an increase of 4.2 percent. Services increased 0.8 percent, compared with an increase of 0.1 percent.
I: Real nonresidential fixed investment increased 17.0 percent in the second quarter, compared with an increase of 7.8 percent in the first. Nonresidential structures increased 5.2 percent, in contrast to a decrease of 17.8 percent. Equipment and software increased 21.9 percent, compared with an increase of 20.4 percent. Real residential fixed investment increased 27.9 percent, in contrast to a decrease of 12.3 percent.
X & M: Real exports of goods and services increased 10.3 percent in the second quarter, compared with an increase of 11.4 percent in the first. Real imports of goods and services increased 28.8 percent, compared with an increase of 11.2 percent.
G: Real federal government consumption expenditures and gross investment increased 9.2 percent in the second quarter, compared with an increase of 1.8 percent in the first. National defense increased 7.4 percent, compared with an increase of 0.4 percent. Nondefense increased 13.0 percent, compared with an increase of 5.0 percent. Real state and local government consumption expenditures and gross investment increased 1.3 percent, in contrast to a decrease of 3.8 percent.
The personal savings rate increased to 6.2% compared with 5.5% in Q1 2010.
Here is another point discussing the various revisions made to GDP going back to 2006..

Fixed Investment & Trade Deficit
The key is the leaky hole in the leaky bucket - the trade deficit. Fixed investment is showing a performance like 1950 but trade is killing the economy. Government spending is increasing modestly, despite all the noise on both sides.
The economy would be growing at over 6 percent if there was no trade deficit. Anything and everything that helps trade.
Burton Leed
1950?
I'll have to look at that one but yeah it's greatly improved. The trade deficit is just more evidence of shipping our national economy to china, offshore outsourcing our jobs and this government will not do a damn thing about it.
What I was shocked about was the revisions. Granted I haven't followed GDP BEA reports for ages, but I saw those revisions and just said, well, who can rely on any of these statistics with changes, dramatic changes, going back 3 years.