The April 2012 S&P Case Shiller home price index shows a -1.9% decline from a year ago for over 20 metropolitan housing markets and a -2.2% decline for the top 10 housing markets from April 2011. Home prices are now comparable to May 2003 levels for the composite-20 and March 2003 for the composite-10, but up for the month. Both composites are now down -34% from their 2006 home price bubble peaks. March 2012 home prices were record lows. Below is the yearly percent change in the composite-10 and composite-20 Case-Shiller Indices. These are not seasonally adjusted, but comparing from April 2011.

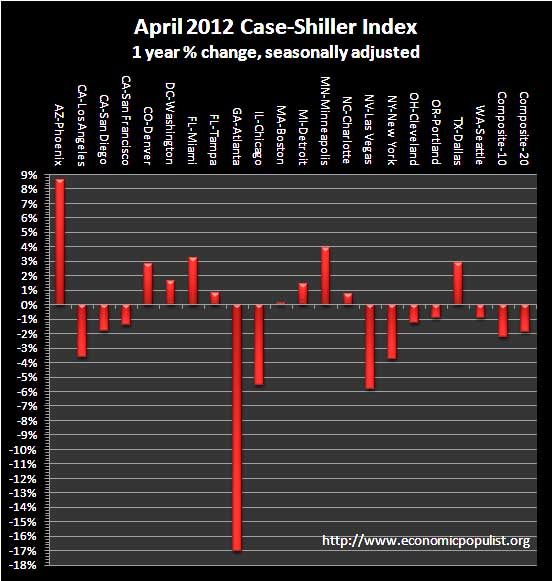
Below are all of the composite-20 index cities yearly price percentage change, using the seasonally adjusted data. We can see the burning of Atlanta, year, down 17% from a year ago While we have a Phoenix rising, up 8.6%, bear in mind Phoenix is down 51% from its peak.
S&P reports the not seasonally adjusted monthly data for their headlines. Housing is highly cyclical. Spring and early Summer are when most sales occur. See the bottom of this article for their reasoning.
This month the not seasonally adjusted March to April change for the composite-20 was +1.3%. The seasonally adjusted composite-20 monthly change was +0.7% (maroon). The composite-10 not seasonally adjusted monthly change was also +1.3% and the seasonally adjusted composite-10 monthly change was +0.7% (blue). The below graph shows both composites, using the seasonally adjusted series.
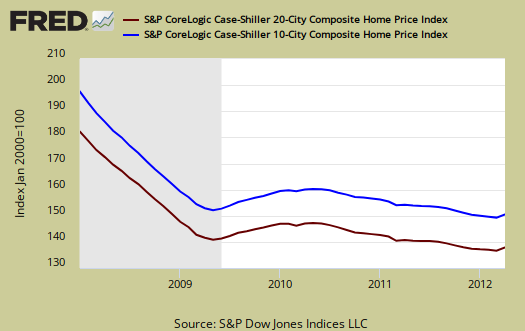
The above graph shows the composite-10 and composite-20 city home prices indexes, seasonally adjusted. Prices are normalized to the year 2000. The index value of 150 means single family housing prices have appreciated, or increased 50% since 2000 in that particular region. These indices are not adjusted for inflation.
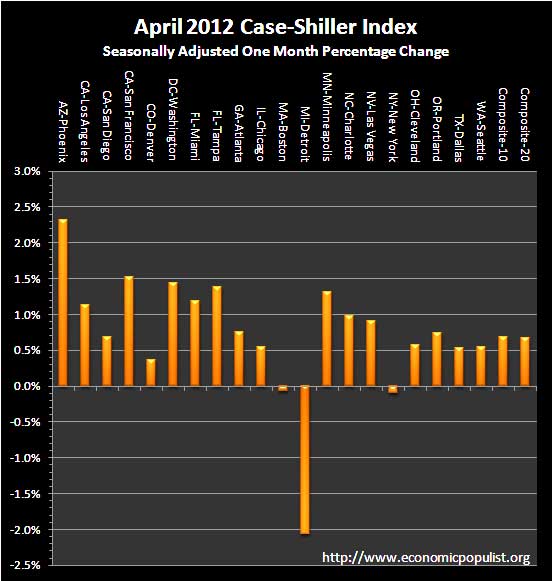
News headlines on the S&P Case-Shiller Housing Index often differ. Some in the press use the seasonally adjusted data, and others do not. S&P themselves use the not seasonally adjusted housing price data. To make matters worse, some in the press compare just the monthly not seasonally adjusted data and others compare the housing price index to one year ago, without telling you what number they are quoting from S&P. Below are the seasonally adjusted monthly home price percentage changes for each City reported by S&P.
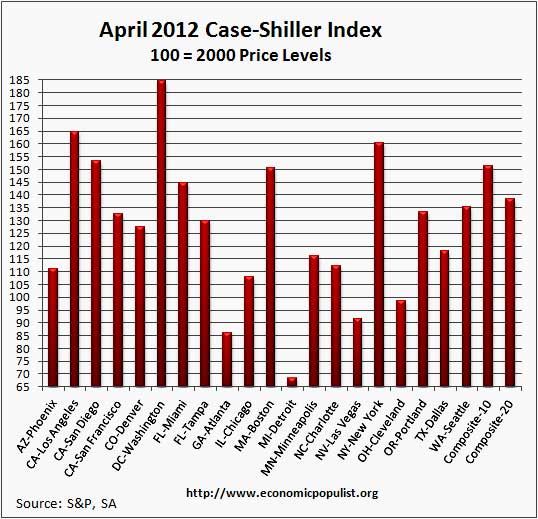
Below are the seasonally adjusted indices for this month. Folks spin these indexes with percentages while the index itself tells you what has happened to home prices, per city, from the year 2000. Remember the below is seasonally adjusted.
Either way you look at this month's data, most metropolitan area housing prices came off from their bottoms, except for Detroit. Both Boston and New York had little change. From the S&P press release, using the not seasonally adjusted home price indices:
Detroit and New York stand out this month as the only two MSAs that saw their annual rates of return deteriorate compared to March. While Detroit posted a positive annual rate of 1.2%, it was still well below March’s +3.9%; New York was -3.8% in April down from -3.0% in March. Detroit was also the only city to show a monthly decline, down 3.6%.
To Season or Not to Season, That is the Question:
The S&P/Case-Shiller Home Price Indices are calculated monthly using a three-month moving average and published with a two month lag. Their seasonal adjustment calculation is the standard used for all seasonal adjustments, the X-12 ARIMA, maintained by the Census.
So, why would S&P report the not seasonally adjusted data? According to their paper on seasonal adjustments, they claim the not seasonally adjusted indices are more accurate. It appears the housing bubble burst screwed up the cyclical seasonal pattern. What a surprise, although those steep cliff dives are now going back to 2009, one would think the seasonally adjusted data would now start to converge back to it's cyclical, seasonal pattern.
The turmoil in the housing market in the last few years has generated unusual movements that are easily mistaken for shifts in the normal seasonal patterns, resulting in larger seasonal adjustments and misleading results.
To see S&P's argument in action, look at the below graph. The maroon line is the seasonally adjusted national index, reported quarterly. The blue line is the not seasonally adjusted national index. As we can see before the housing bubble burst, we see a typical cyclical pattern difference between the seasonally adjusted and not seasonally adjusted data points. Yet after the bubble burst we see large swings, which would throw off a seasonal adjustment adaptive algorithm. This is going to become a major question among statisticians, how does one adjust for seasonality in the face of tsunami like economic events?
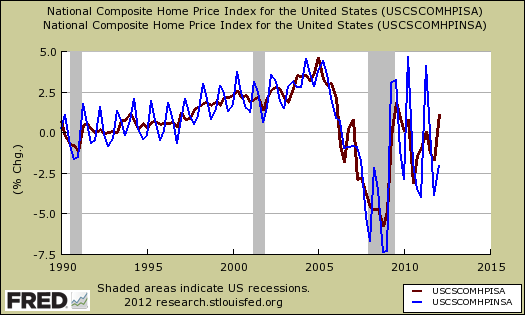
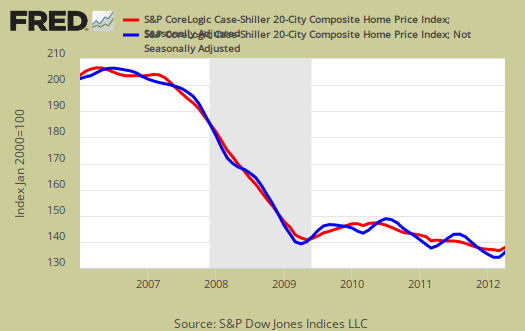
Not seasonally adjusted data can create more headline buzz on a month by month basis due to the seasonality of the housing market. S&P does make it clear that data should be compared to a year ago, to remove seasonal patterns, yet claims monthly percentage changes should use not seasonally adjusted indices and data. This seems more invalid than dealing with the statistical anomalies the massive housing bubble burst caused. Below is the seasonally adjusted and not seasonally adjusted Composite-20 Case-Shiller monthly index.
For more Information:
S&P does a great job of making the Case-Shiller data and details available for further information and analysis on their website.
Here is our overview from last month.

the hysteria is incredible on home prices, sales
Folks, look, we may have hit a bottom, although I'm not so sure on home prices, but in terms of sales, rolling around there, but over 1 month, just 1 month of data we have some claiming everything is rosy, home prices will rise 10%, sales will increase, construction jobs are coming back and the economy is "on the mend".
This is ridiculous! The NAR especially claims this and has been doing so, no matter what the data says and they are all about realtors, so do not believe their hype.
One month of data does not a trend make at all, not by a long shot. Just unreal how various press and pundits jump on one month's of data and make declarations. You cannot do that, even with a quarter's worth of data. 6 months, ok, you can say something.
NAR is the real estate equivalent of CNBS + CNN Money for stocks
Of course they call the bottom + improvement, they've been doing that for the last few years again . . and again. At some point they might be right, but the end of the world might come before. NAR needs that hope/delusion, that's why they run those tired ads about homeowners building communities. Is there an ad about BOA destroying homeowners' lives or Detroit levelling entire neighborhoods and cutting off fire and police protection because of thousands of vacant homes or the massive shadow inventory banks are keeping off the market to raise prices artificially? No? Of course not. NAR needs that false hope so people will spend $ they don't have, like GE/CNBS/NBS and Microsoft/NBC optimism no matter what because reality doesn't sell ads or attract viewers turned off by dismal reality. When the $ men and ad men need consumers and home buyers, the message is clear - OPTIMISM CREATES SALES FOR THE CORPORATIONS, YOU WILL BE OPTIMISTIC DESPITE REALITY IN ALL STORIES AND ADS.
notice how income is never mentioned?
People these days are so broke, they have no retirement, are not even making it paycheck to paycheck, wages are so low, if they have a job.
I might direct you to over existing home sales overview. Pretty much on every NAR statistical release I poke holes in what they claim, this month, not so much. Housing, residential real estate generally I find absolutely ridiculous with the lack of the obvious. People need good, full-time, stable jobs to buy a home and in the U.S., basically the middle class has disappeared.
Anyway, check out the foreign buyers of existing homes in that overview. Since they wiped out the U.S. middle class they are looking at residential real estate as something to "export/import", at least some are.
Banksters pull the same tricks everywhere they slither
This bankster trick is obvious and has been pulled elsewhere and here in recent times and the past. They burden the public govts. with debt or screw over individual citizens (e.g., GS cooking Greece's books, BOA screwing over individuals through robosigning, municipal bankruptcies that are now multiplying here, etc.). Then, public entities like those declaring bankruptcy in Europe or here in the US have no way of paying off debts. Same with people in foreclosure (and of course many are legitimately foreclosed on, but many aren't). So how, oh how, will those debts be paid off? No problem, the banksters go to their playbook. Well, banksters swoop in, buy real assets for pennies on the dollar through incredibly not "fair and open auctions" not conducted at arm's length. And then they turn around and sell real assets to foreigners or rich fellow banksters, real estate developers, casino owners, and other truly noble job creators at discounted, but still much higher prices from the original prices that bankrupted govt. and citizens.
Quite a rigged game that should make everyone with a soul sick. So what real IP and technology and assets foreigners cannot buy and steal overseas, the banksters will simply sell to them here. Who wants to buy a road? Ports? Schools? Prime real estate? Warehouses? Turnpikes and highways? Foreigners of course, and it's all "capitalism" in its newest, sickest form. Why not sell AF bases, the USMA, USNA, beaches, nuclear subs, nuclear reactors, and everything else. Hey, why not, let's go back to the Gilded Age and have the Chinese (instead of Carnegie and Rockefeller) buy up all the land around a farm or store or house and force the resident or store owner to trade with them or sell to them exclusively. Just like the robber barons of old. And in the new schools, Chinese will be taught, capitalism will be redefined, and those damn Founding Fathers will suddenly echo all that Murdoch, and the D & R, and our new masters in Beijing and New Delhi and Wall Street demand they say.
Teddy Roosevelt, paging Teddy Roosevelt, please come down and return to your Nation's capital ASAP.