The November 2012 S&P Case Shiller home price index shows a 5.5% price increase from a year ago for over 20 metropolitan housing markets and a 4.5% change for the top 10 housing markets from November 2011. Not seasonally adjusted home prices are now comparable to September 2003 levels for the composite-20 and October 2003 for the composite-10. Below is the yearly percent change in the composite-10 and composite-20 Case-Shiller Indices, not seasonally adjusted.

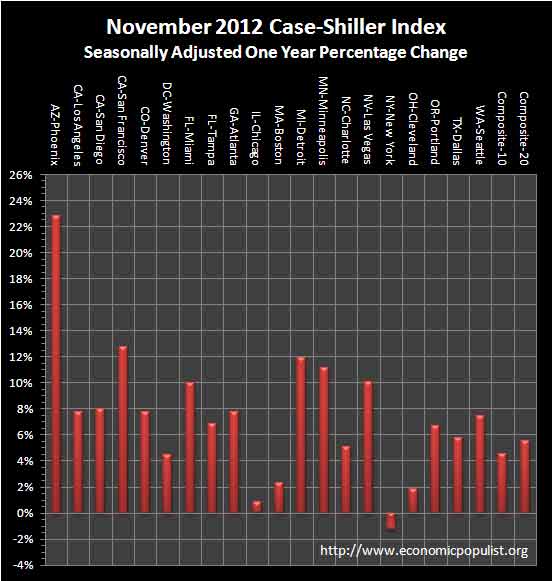
Below are all of the composite-20 index cities yearly price percentage change, using the seasonally adjusted data. We see Phoenix soaring, up 22.8% from a year ago and only, New York City down -1.2%. Atlanta has clearly hit bottom and prices have risen 7.7% from last year. The seasonally adjusted price indexes show, the composite-20 yearly percentage change was 5.6% and the composite-10 yearly percentage change was 4.6% and the difference between these figures and the not seasonally adjusted ones is rounding error.

S&P reports the not seasonally adjusted data for their headlines. Housing is highly cyclical. Spring and early Summer are when most sales occur. See the bottom of this article for their reasoning.
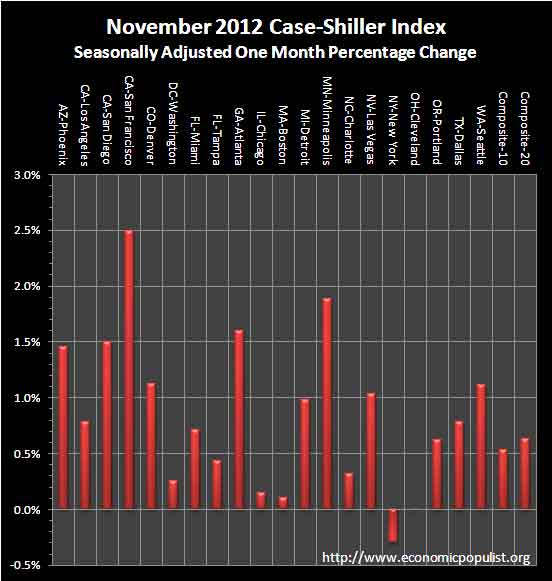
For the month, the not seasonally adjusted composite-20 percentage change was -0.1% whereas the seasonally adjusted change for the composite-20 was +0.6%. The monthly not seasonally adjusted composite-10 percentage change was -0.2%, whereas the seasonally adjusted composite-10 showed a 0.5% increase. This is the start of winter and the end of the buying season, so no surprise the seasonally adjusted and not seasonally adjusted figures do not match.

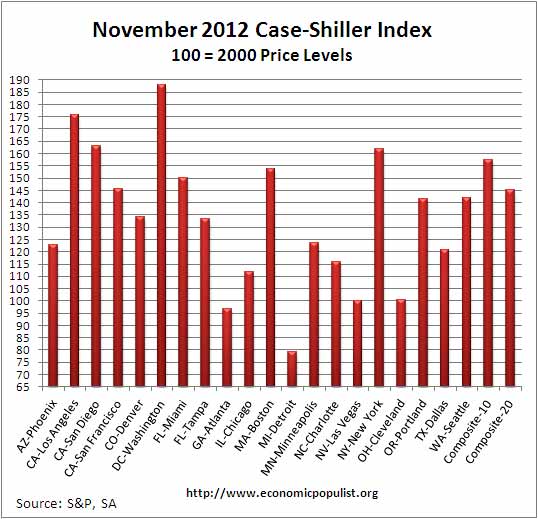
The above graph shows the composite-10 and composite-20 city home prices indexes, seasonally adjusted. Prices are normalized to the year 2000. The index value of 150 means single family housing prices have appreciated, or increased 50% since 2000 in that particular region. These indices are not adjusted for inflation.
News headlines on the S&P Case-Shiller Housing Index often differ. Some in the press use the seasonally adjusted data, and others do not. Some report the monthly change, others the annual change. S&P themselves use the not seasonally adjusted housing price data. To make matters worse, some in the press do not specify which statistic they are quoting from S&P. Below are the seasonally adjusted monthly home price percentage changes for each City reported by S&P.

Below are the seasonally adjusted indices for this month. Folks spin these indexes with percentages while the index itself tells you what has happened to home prices, per city, from the year 2000. Profit makers are all about the annual change whereas homeowners who bought over a decade ago are worried about the levels and how underwater they still are with their mortgages.

S&P estimates home prices are down approximately 30% from the height of the housing bubble's June and July 2006 price peaks. These statistics use the not seasonally adjusted home price indices.
Either way you look at this month's data, most metropolitan area housing prices are increasing and in strong recovery. From the S&P press release, using the not seasonally adjusted home price indices, S&P is saying the housing prices for the composite indexes have increased 8%-9% since early 2012. While this is great news showing the housing collapse is over, in terms of affordability for working families, it's really not. One simply cannot afford even a $200,000 mortgage when a household earns $42,000 a year, never mind a $300,000 one.
Winter is usually a weak period for housing which explains why we now see about half the cities with falling month-to-month prices compared to 20 out of 20 seeing rising prices last summer. The better annual price changes also point to seasonal weakness rather than a reversal in the housing market. Further evidence that the weakness is seasonal is seen in the seasonally adjusted figures: only New York saw prices fall on a seasonally adjusted basis while Cleveland was flat.
To Season or Not to Season, That is the Question:
The S&P/Case-Shiller Home Price Indices are calculated monthly using a three-month moving average and published with a two month lag. Their seasonal adjustment calculation is the standard used for all seasonal adjustments, the X-12 ARIMA, maintained by the Census.
So, why would S&P report the not seasonally adjusted data? According to their paper on seasonal adjustments, they claim the not seasonally adjusted indices are more accurate. It appears the housing bubble burst screwed up the cyclical seasonal pattern. What a surprise, although those steep cliff dives are now going back to 2009, one would think the seasonally adjusted data would now start to converge back to it's cyclical, seasonal pattern.
The turmoil in the housing market in the last few years has generated unusual movements that are easily mistaken for shifts in the normal seasonal patterns, resulting in larger seasonal adjustments and misleading results.
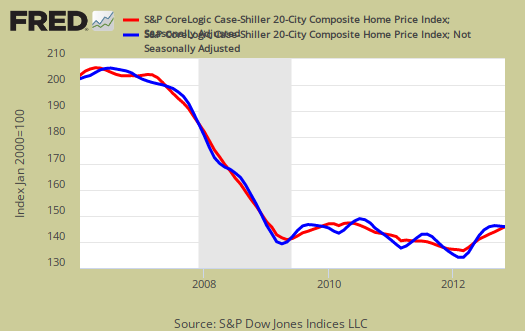
To see S&P's argument in action, look at the below graph. The maroon line is the seasonally adjusted national index, reported quarterly. The blue line is the not seasonally adjusted national index. As we can see before the housing bubble burst, we see a typical cyclical pattern difference between the seasonally adjusted and not seasonally adjusted data points. Yet after the bubble burst we see large swings, which would throw off a seasonal adjustment adaptive algorithm. This is going to become a major question among statisticians, how does one adjust for seasonality in the face of tsunami like economic events?

Not seasonally adjusted data can create more headline buzz on a month by month basis due to the seasonality of the housing market. S&P does make it clear that data should be compared to a year ago, to remove seasonal patterns, yet claims monthly percentage changes should use not seasonally adjusted indices and data. This seems more invalid than dealing with the statistical anomalies the massive housing bubble burst caused. Below is the seasonally adjusted and not seasonally adjusted Composite-20 Case-Shiller monthly index.

For more Information:
S&P does a great job of making the Case-Shiller data and details available for further information and analysis on their website.
Here is our Case-Shiller past overviews as well as the overviews of residential real estate statistics.

bubble returns
The news is truly hyping these figures and the current "buying" frenzy has much more to do with massive shortage of supply due to so much inventory being kept off of the market and also record low interest rates.
Bubbles, bubbles, everywhere
Isn't this the plan? Someone's making money off the bubbles and those people are banksters and politicians. They are keeping the Ponzi going as long as possible, taking their %s while it lasts, and then will sit there with fake sad faces when it blows up again and ask with crocodile tears, "Who could have known?" as they fly off to their coke-fueled parties in one of their secure retreats.
Education bubble - what happens when people have every degree imaginable, pay the academic banksters (i.e., loan companies, the politicians that own their stocks, and university administrations) $50,000 - $500,000 for no jobs (overqualified for Starbucks, sorry, they tell them so too) and the bastards in control still want more visa recipients to take any job that might open up? No jobs, massive debts, and wiping one's ass with a BS in Chem. E.? Loan bubbles, baby. While jackasses on TV that dropped out because they couldn't hack school call the engineers and everyone else with all these degrees dolts and lazy. Yup, that's how the USA rolls in 2013.
Stock market - Bernankster wanted the bubble, just like Greenspan did, "feeling good"/wealth effect bubble. ZIRP, Fed loans to private dealers = trillions being pumped into everything under the Sun. Geniuses at work, really, they are.
Housing? Sure, artificially keep houses off the market and/or not speed up foreclosures or short sales to jack up prices.
Plenty more bubbles out there, obvious to anyone that looks. Me, I know for sure Facebook's stock is definitely here to stay and will hit the moon soon. Apple too will come back and hit $1000 or even $2000 because they told me so and people on TV and in power are smart, honest, and paid to tell me the truth and not sell me snake oil.
bubble economy and economic insanity
Right, they are trying to return to 2006/2007 with the same bad policies and same mentality. It is astounding considering what happened.
No, it's predictable - they got bailed out, richer, we got raped
Why would they change anything? They screwed up the globe, we bailed them out against our will. We saw nothing come out of it (e.g., no return to Glass-Steagall, no punishment of banksters or corporate bigwigs, or anyone else, and certainly no prison + forfeitures, Greenspan still viewed by the criminal cabal as the Wise One, Dimon and others still risking the globe with trillions in derivatives they don't understand, NAFTA still in full force, etc.) and actually things got/are getting worse for us regarding unemployment while they made record profits.
So they know they never suffer or lose any $ or power - why not go full bore once again, they won't lose anything.
1) Are they still partying in Davos? Check.
2) Still getting their asses kissed on MSM and actual control of MSM? Check.
3) Unearned massive salaries for lying and theft and criminal cartel conduct? Check.
4) Bonuses? Check.
5) Running Treasury, Bank of England, ECB, controlling the White House, EU, World Bank, etc. through donations and favors and appointments at top levels (including legions of Goldman Sachs alum)? Check.
6) The small criminal elite still talked about like they are the only people worthy of "public service"? Check.
7) The media still lying through its teeth? Check. Why just today, USA Today and other newspapers were claiming the contraction in GDP was a sign that the economy was still on its slow, perpetual recovery, no need to worry. Yes, that's right, normally that means we are in a recession or headed for one, but in 2013, it means "recovery right on course" along with unemployment levels near Great Depression I levels with no improvement.
And the lies continue and the criminals and liars get richer, and richer, and richer.