The U.S. June 2013 monthly trade deficit cliff dove -22.4% from last month to $34.2 billion. This is the smallest trade deficit since October 2009 when the world was plunged into a global recession. A combination of a dramatic drop in oil imports along with solid U.S. exports in fuel oil, capital goods and jewelry was the reason for the deficit decline. Q2 GDP should be revised upward past 2.0% as shown below.

This month's trade deficit gives an annualized -$473.9 billion Q2 deficit, whereas the the Q2 GDP report gives a -$538.5 billion annualized trade deficit. The original estimate for the nominal, or not using chained 2009 values, trade deficit resulted in an 12.3% annualized increase, while June's monthly figures now give a -32.6% annualized decline. That's over 2.6 times lower than the estimated June trade deficit gave for the GDP report. While price indexes and other adjustments have not been applied, it's a safe bet to assume the trade components to GDP will be revised upward on the significantly lower trade deficit. We estimate that the June trade figures will result in a +1.3 completely unadjusted percentage point trade component contribution to GDP, thus raising Q2 from 1.7% to at least 2.5%, depending on import and export prices as well as the price index. The original trade component to GDP was -0.81, although this is adjusted through real values as well as import and export price adjustments. Bottom line, it is guaranteed the trade component of Q2 GDP will be positive and dramatically higher.
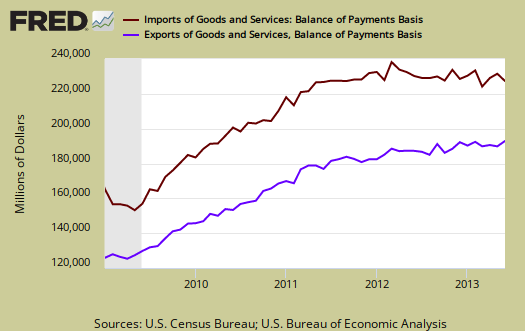
Unlike 2009, the dramatic trade deficit shrink was not due to overall global trade collapsing. Graphed below are imports and exports graphed and by volume, we can see there is not a dramatic decline in both directions as there was in 2009. Exports increased 22% from last May while imports declined 2.5%. The increase in exports also bodes well for increased real GDP in terms of price adjustments, although oil is in a category all its own.

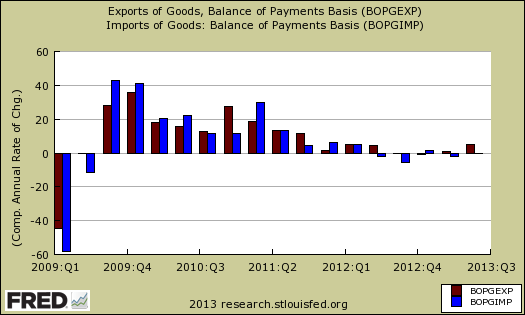
Below is a graph of the quarterly annualized percent change in imports (blue), against exports (maroon) to show the rarity of having exports increase more than imports per quarter. While this report is great news, don't expect it to last. Generally speaking the U.S. labor arbitrage, offshore outsourcing, trade agenda has hurt and will continue to erode the U.S. economy. This quarter is more a lesson in what happens to U.S. economic growth when we manufacture in the United States and export from the United States.

Below are the goods import monthly changes, seasonally adjusted. On a Census basis, overall imports decreased by $5,987 billion to $191,084 billion as fuel oil and petroleum imports plunged by over one billion each. Oil related imports are part of industrial supplies and materials. Another interesting decline was in cell phones. The U.S. imported almost $1.5 billion less in cell phones and other household goods for June. All recall the new Motorola launch, the Moto X smartphone, has many components, including assembly, made in the United States. Lest we forget, the Department of Defense does import and their spending dramatically declined due to the sequester. Unfortunately the lack of trade detail breakdowns make determining the DoD import amounts beyond the scope of this overview.
- Industrial supplies and materials: -$2.522 billion
- Capital goods:+$0.007 billion
- Foods, feeds, and beverages: -$0.403 billion
- Automotive vehicles, parts, and engines: -$0.296 billion
- Consumer goods: -$1.620 billion
- Other goods: -$1.153 billion
Below is the list of good export monthly changes, seasonally adjusted, by end use and on a Census accounting basis, overall soared by $4.259 billion to $129.054 billion. We say soar sarcastically for in comparison to your typical monthly import increases, U.S. exports are still a drop in the deficit bucket. With gas hovering around $4 a gallon, the United States exported $898 thousand worth of fuel oil in June. The capital goods exports were good news with aircraft engines, telecommunications equipment and industrial engines all showing healthy gains. Consumer goods is all jewelry and gemstones, over a billion tallied together.
- Automotive vehicles, parts, and engines: -$0.439 billion
- Industrial supplies and materials: +$1.514 billion
- Foods, feeds, and beverages: +$0.343 billion
- Capital goods: +$1.463 billion
- Consumer goods: +$1.048 billion
- Other goods: -$0.330 billion
Oil or petroleum showed an end use trade deficit decline for the month of $1.377 billion to -$17.408 billion for the petroleum related portion of the goods trade deficit. That is a decrease of -16.2% in a month. Petroleum related end use was 33.6% of the goods trade deficit, a significantly lower as a percentage than typical months. End use means the final use of the product and includes oil byproducts. For example, plastics are made up of petroleum, yet by their end use category, would be marked often as consumer goods. This change appears to be volume as the price per barrel barely changed from last month, an increase of only 9¢ to $96.93 When gasoline and other petroleum products costs increase, demand does decline.
Don't expect this month's results to last, although the news is a welcome change and if anything these results should tell you strongly the United States needs to support and grow our manufacturing base not just for American jobs, but as a vital element in economic growth.
Here are other trade deficit overviews, data unrevised.

wholesale inventories negatively impacting GDP
Wholesale inventories were low and will reduce Q2 GDP. We're going to wait to give a figure until retail inventories are released for June, August 13th. Wholesale inventories are about 25% of all inventories, non-farm, so to get a guesstimate on how much this will negatively impact GDP if they decline we'll try to get closer to all nonfarm inventories. Finally, don't forget that farm inventories boosted Q1 GDP and we will not have those in the monthly release.